Let’s be honest, turbulence in the sky can be slightly (or even majorly) terrifying, especially when you are not expecting it.
But when you know to expect a little bit of rocking in the cabin, turbulence isn’t quite so bad.
Luckily, you don’t need a fortuneteller to help you and there are ways that you can check to see what type of turbulence you might be hitting ahead of time.
Below, I will review a few different turbulence maps that you can view prior to your flight so that you can have an idea of what to expect on your journey.
I’ll also drop some interesting facts about turbulence that you may not have ever known.
Table of Contents
What is turbulence?
Turbulence is basically a change in airflow resulting from eddies and vertical currents that is felt to varying degrees based on things like the size and speed of your aircraft. It could come in a mild form that only results in a couple of small bumps felt or it could be very severe and even cause damage to the plane.
What is a turbulence map?
A turbulence map is a map that you can check that will predict the level of turbulence that you can expect during your flight.
Tip: Use the free app WalletFlo to help you travel the world for free by finding the best travel credit cards and promotions!
Different turbulence maps
There are different types of turbulence maps out there that you can check but generally I only check one or two and I will show you where to find them below and also explain how they work.
These maps often are the same or similar when it comes to detecting severe turbulence but if you want to check for all levels of turbulence, you might need to check both maps out because they don’t always report the same findings.
Turbulence Forecast
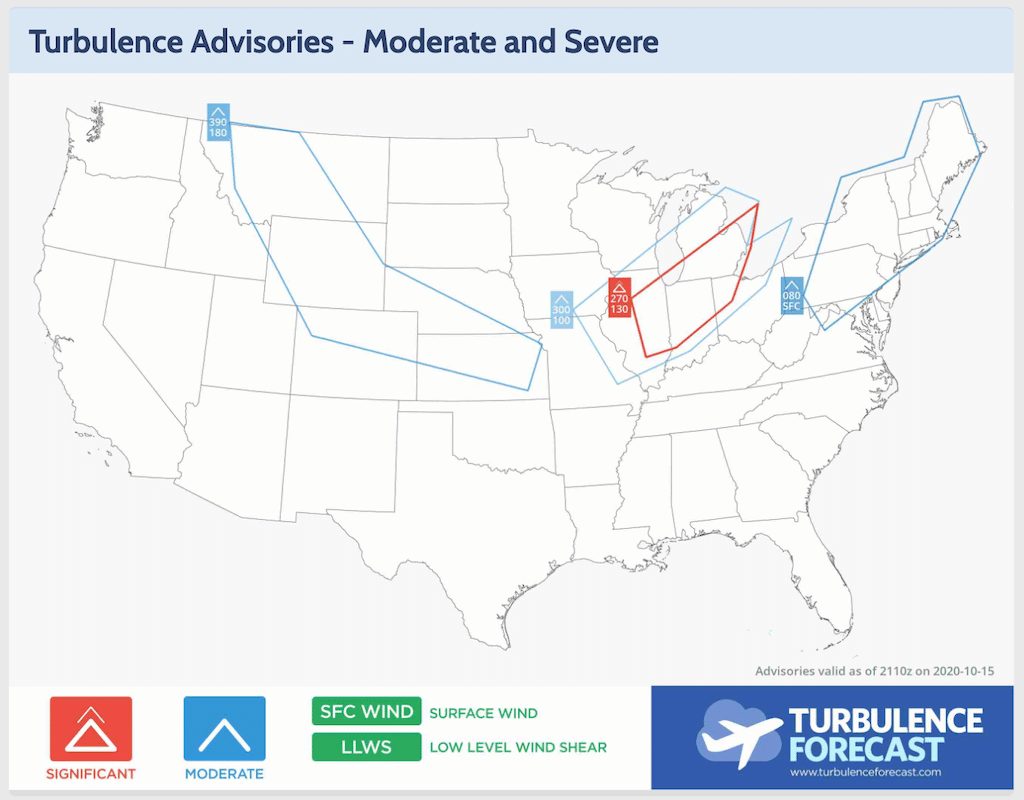
The map that I generally use is the Turbulence Forecast.
This map will show you where turbulence might be significant or where it might just be moderate.
It also will show you where to expect surface winds and low level wind shear.
Surface winds are simply winds that are near the Earth’s surface. And according to the FAA, wind shear is a “change in wind speed and/or direction over a short distance.” These can occur at both high and low altitudes.
If you see a blue section on the map that means the turbulence threat is “moderate” and if you see a red section that means it is “significant.” In some cases, you won’t see anything which means that the skies are pretty clear.
In addition to the colors, you can also see the altitudes that the advisory would be in effect for.
For example, if you see 400 to 240, that would mean that you could expect that level of turbulence between 40,000 feet down to 24,000 feet.
Aviation Weather Center (NOAA)
You can also use the Aviation Weather Center website by the NOAA. There are three different maps on that website that you can view.
These maps are not as user-friendly as the one above but they do provide different types of data points that many aviation geeks will find interesting.
Turbulent SIGMETS
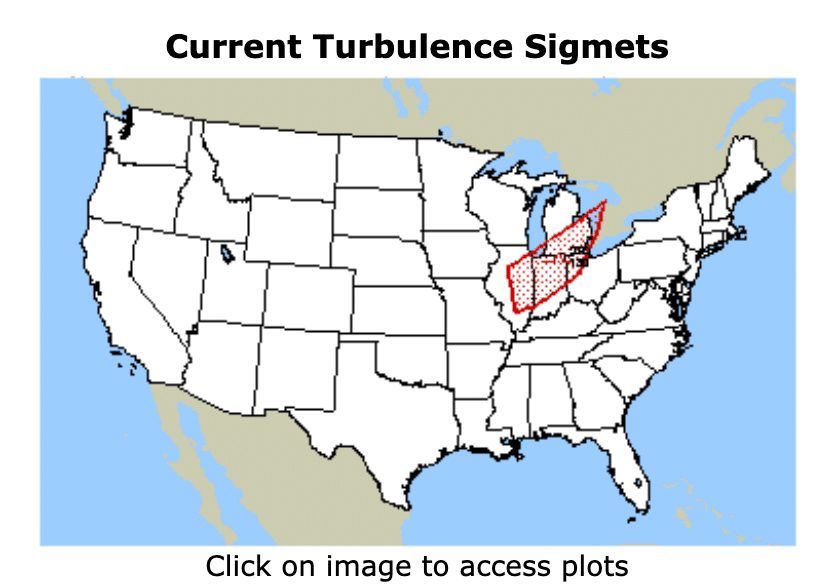
The first map shows current turbulent SIGMETS (Significant Meteorological Information).
SIGMETS are weather advisories that contain meteorological information concerning the safety of all aircraft.
You can look for a dotted red, likely rectangular/trapezoid shape that indicates current areas where turbulence may be found.
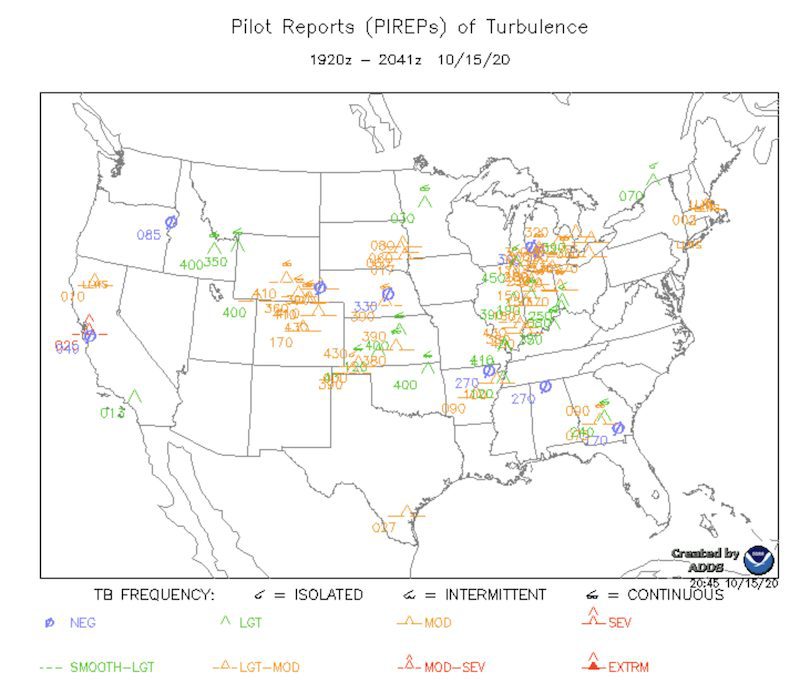
Current turbulence aircraft report
Another option is to view the current turbulence reports from aircraft.
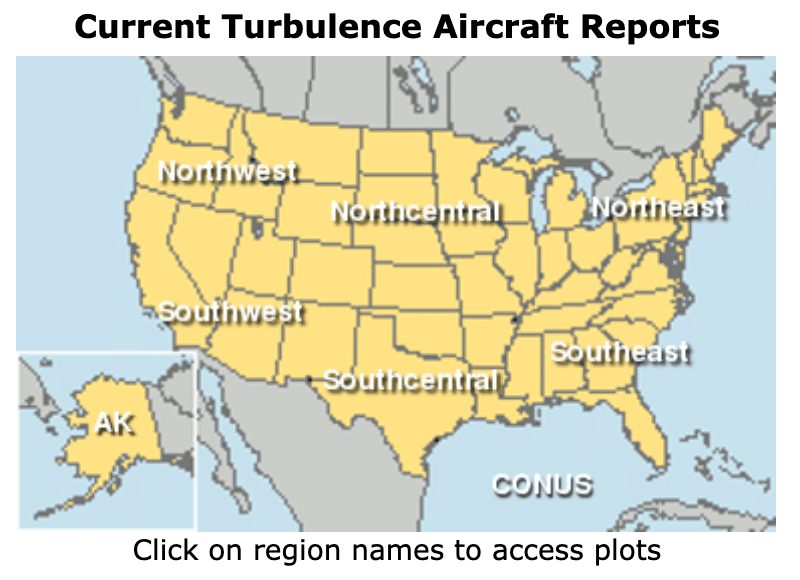
Simply click on a region such as the “Southwest” to see a breakdown of the recently reported turbulence encounters.
These data points are known as PIREPs or simply “Pilot Reports.”
These are typically radioed in from the pilot down to the ground station. The message is then encoded and relayed to other weather offices and air traffic service units.
On this map, there are different types of turbulence reports that are shown.
Basically, you can see if the turbulence experienced was “negligible, light, moderate, or severe.”
They also have readings for smooth to light, light to moderate, moderate to severe, and extreme.
So this is a much more specific type of predictor of what is happening in the sky.
Depending on the amount of reports, the PIREPs markings on the maps can be pretty jumbled but if you see a strong cluster of marks then that is usually where turbulence is occurring.
For example, take a look at the map below and you can see quite a bit of markings in the Midwest area which also corresponds to the map above.
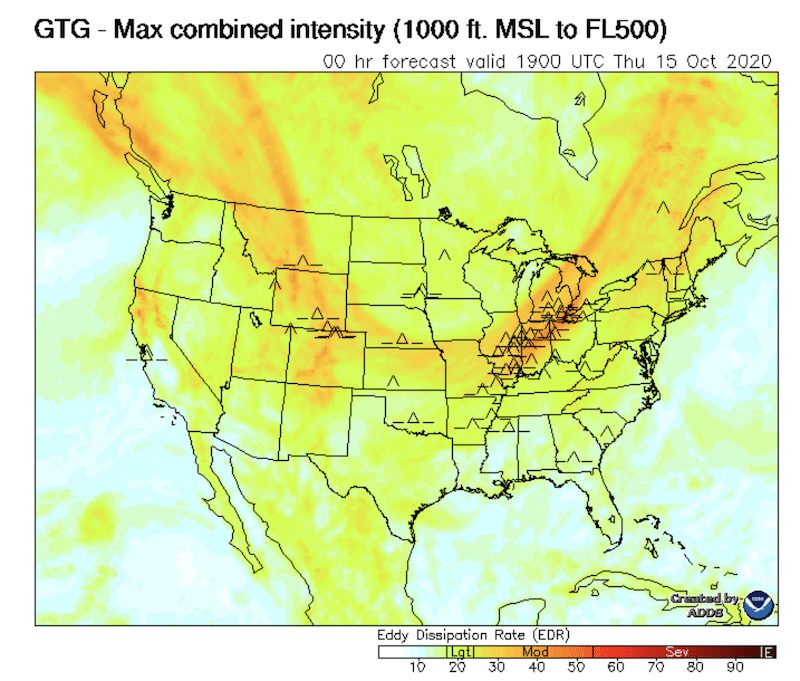
Graphical Turbulence Guidance
The next map that you can view is the Graphical Turbulence Guidance.
You can take a look at the Eddy Dissipation Rate (EDR) scale at the bottom of this map to see where the most intense forecast is.
The EDR measures the rate at which energy dissipates in the atmosphere. In other words, it’s “a measure of the turbulent state of the atmosphere.”
According to turbulence researcher, Dr. Robert Sharman, “When the atmosphere is dissipating energy quickly (i.e, the EDR is large), atmospheric turbulence levels are high.”
Basically, the way to interpret the scale is that the closer you get to dark red, the more turbulence that you are likely to encounter.
Pilots have to factor in the weight of the aircraft as well as the altitude when looking at such readings in order to accurately forecast the degree of turbulence they will encounter.
As you can see in the map below, it correlates with the pilot report map above and also the sigmets.
The newer version of GTG can forecast clear air turbulence and mountain wave activity which are some things I talk more about below.
So those are some of the different maps you can use to check what type of turbulence is happening in the sky.
Turbulence facts
The United States has a lot of geographical features that cause turbulence across the country.
There are converging jet streams, mountain ranges, and a high incidence of convective activity over the country which will all help to create atmospheric instability.
So if you do a decent amount of flying around the country, chances are you will encounter turbulence at some point.
So to help you understand what is happening in the sky, here are some interesting facts about turbulence.
Tip: Use WalletFlo for all your credit card needs. It’s free and will help you optimize your rewards and savings!
Injuries
As you might expect, turbulence is the leading cause of non-fatal aviation accidents. From 1980 through 2008, there were 298 serious injuries caused by turbulence.
Of those, three individuals died and two of those three did not have a seatbelt on when the seatbelt sign was on.
This is why it is important to pay attention to the seatbelt sign especially if the captain gives an additional warning that turbulence might be ahead.
You simply never know when you could get hit with a major thrust.
Mountain waves
Turbulence often occurs as air blows over mountain ranges and it can reach heights up to 50,000 feet.
If you are passing over a large mountain range such as the Rocky Mountains, there’s a good chance you should be preparing for turbulence or, at a minimum, mountain wave.
Turbulence penetration speed
When pilots know that turbulence is ahead, sometimes they will slow down the aircraft to mitigate the turbulence. This is often referred to as “turbulence penetration speed.”
This is similar to riding through rough water where you can slow down the speed of the boat and not have to deal with the large waves crashing across the bow.
The other major factor is the weight and size of your aircraft which is why the data points for the maps above are interpreted with those factors in consideration.
Clear air turbulence
While radar can often be used to detect turbulence, there is something that is known as clear air turbulence which cannot be detected by conventional aircraft radar systems.
This is caused when bodies of air moving at widely different speeds meet.
The good news is that there is something called LIDAR (Light Detection And Ranging) that is housed under the aircraft’s nose. This uses a combination of radar and lasers to detect the speed of moving particles in the atmosphere.
This actually allows pilots to get an early warning of clear air turbulence.
In some cases the warning may only be something like 45 seconds ahead of the expected turbulence but that can be sufficient time to get passengers and flight attendants secured safely.
Tropopause
The tropopause is a thin layer between the troposphere and the stratosphere found at approximately 30,000 feet. (This layer is found higher at the equator and lower at the poles.)
In this layer, weather phenomena can occur that can cause turbulence and when flights are planned they take into account where the flight will pass through the tropopause.
Wake turbulence
Wake turbulence is caused when a heavy aircraft with a large wingspan pushes air out as it approaches the runway.
If a smaller aircraft is following in that path on the final approach, they could encounter wake turbulence.
The good thing is pilots have been well aware of this for decades so they generally avoid it and know how to recognize it.
Final word
Turbulence is a pretty fascinating thing. It can come in many different forms and luckily we have things like turbulence maps which can help us forecast where it will appear. Be sure to check these maps before your next departure so that you can have an idea of what to expect on your journey.
Daniel Gillaspia is the Founder of UponArriving.com and the credit card app, WalletFlo. He is a former attorney turned travel expert covering destinations along with TSA, airline, and hotel policies. Since 2014, his content has been featured in publications such as National Geographic, Smithsonian Magazine, and CNBC. Read my bio.
