Update:
As more cases of coronavirus rise in the US, many people have questions about which parts of the country have been hit worst.
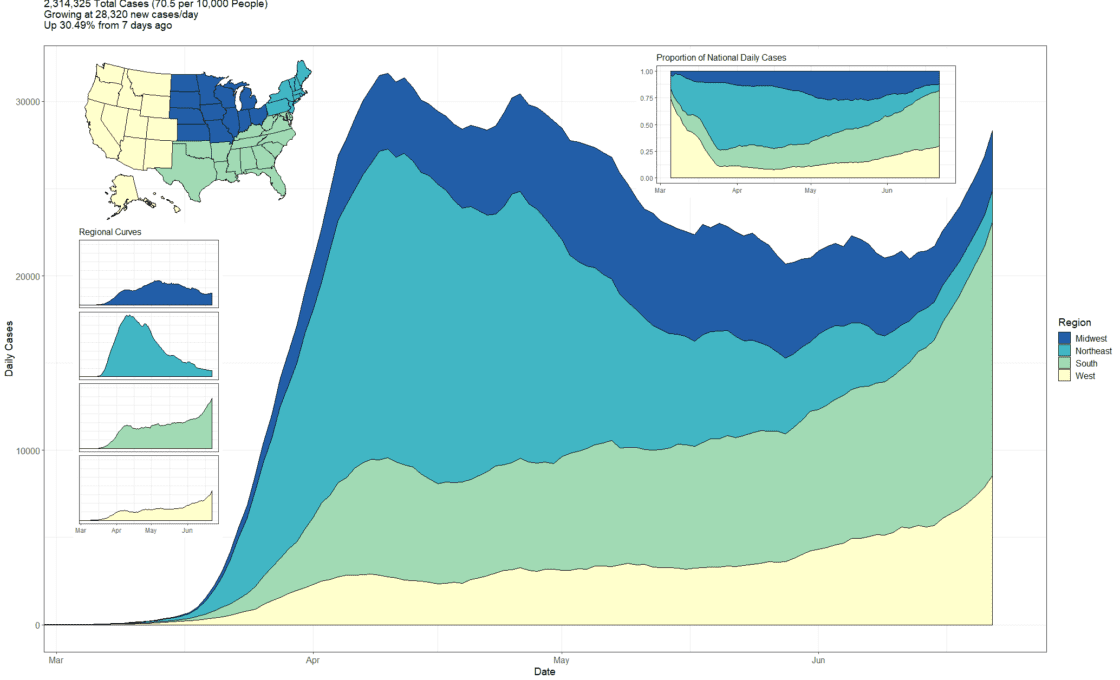
It’s clear that overall the country is on a steep upward trend ever since economies began to reopen.
But it is also clear that not every region in the US is on that steep upward trend in cases.
There’s a new helpful graph that clearly shows that each region in the US is on a different path.
The small graphs on the left clearly show that the Northeast and Midwest have controlled the spike. In the case of the Northeast, they are clearly on a major downward trend while the Midwest has a slight uptick.
However, there is a huge spike in the south and also a pretty substantial rise in the west.
This graph should help a lot of people understand just how different the transmission rates currently are in different places in the country and the importance of focusing on local and regional data.
Original article
It’s no secret that coronavirus is now spiking in cities and states all around the country.
It seems that the grand experiment to re-open the economies is now yielding its results.
And these results show that we are now seeing numbers in several states that are just as bad if not worse than the initial peaks we saw in April.
I think it is important for people to be able to see just how bad (or not bad) things are in their home state.
So I wanted to share this resource where you can see a breakdown of the new cases in your state or in other countries.
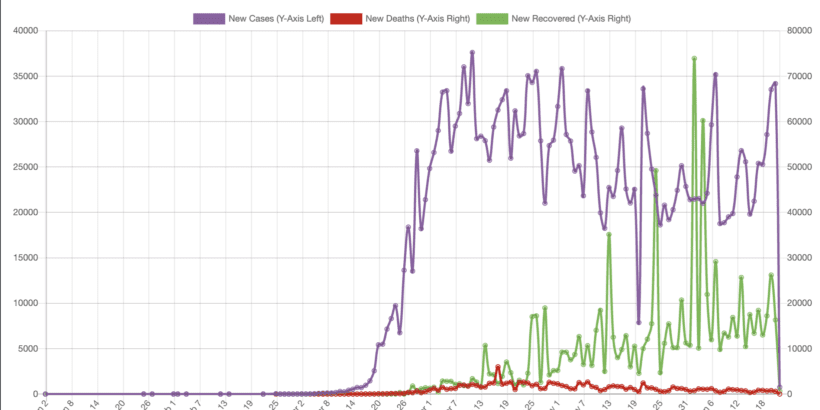
It’s really telling to view the numbers on a graph. For example, I viewed the numbers for Arizona and I saw a staggering number of new cases.
Just look at the purple line and see how bad things have spiked!
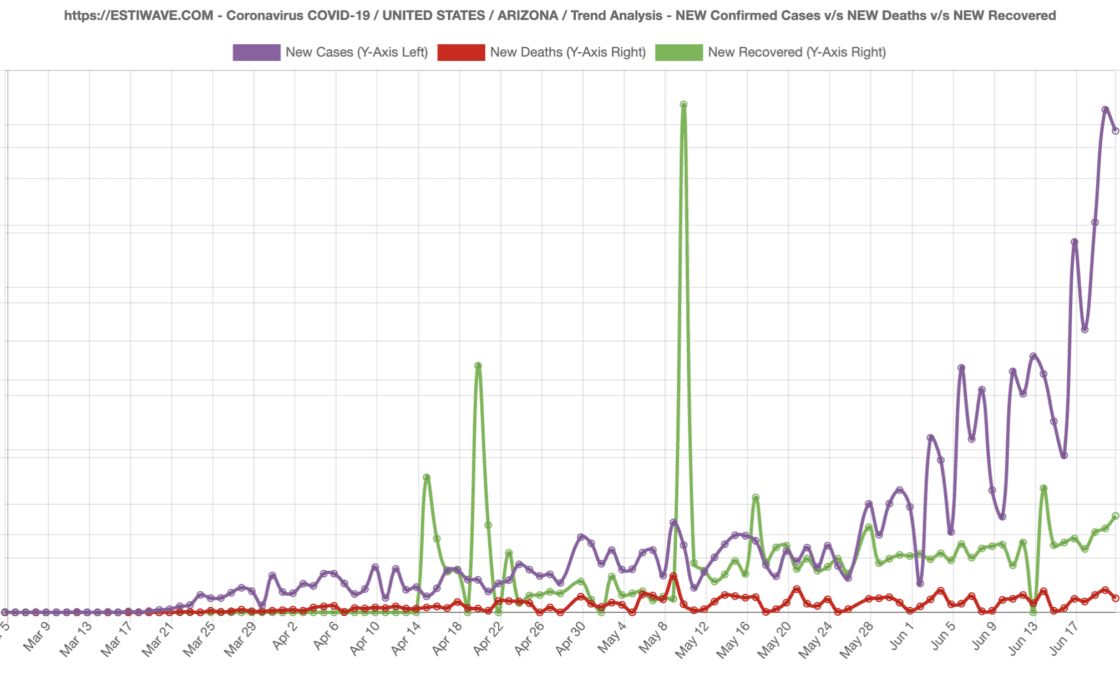
Those numbers are really bad.
And if you look at the numbers for the US as a whole, you’ll see that we are nearly approaching the peak levels we were at in April.
It’s very discouraging considering the progress we were making as a country.
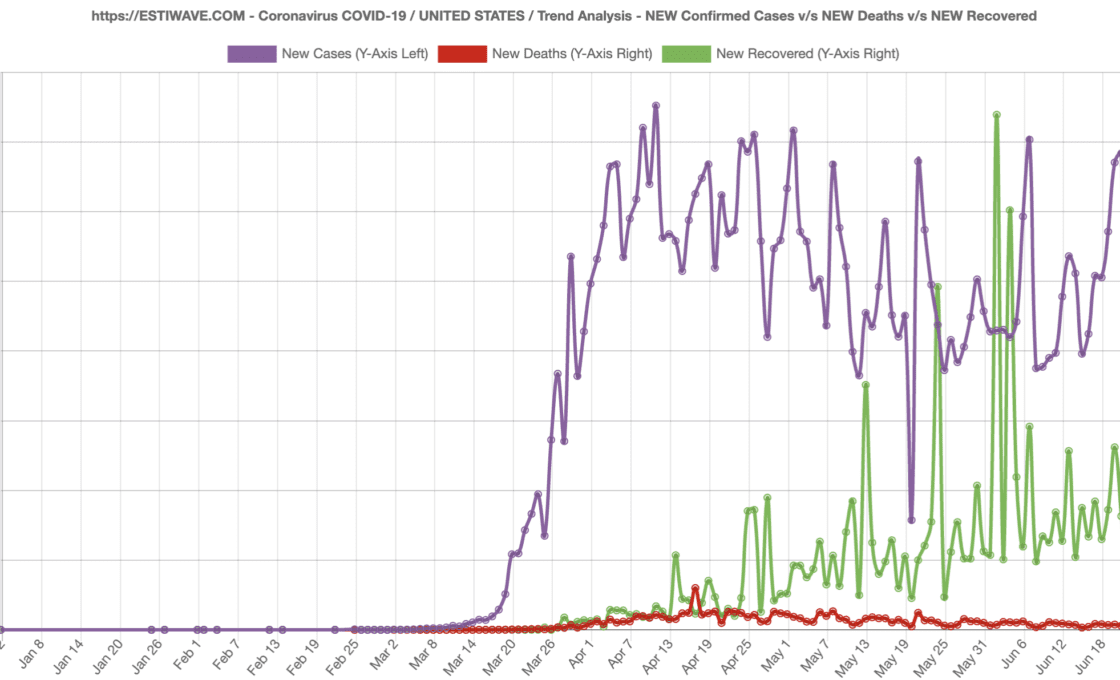
Some of the numbers are the result of increased testing. The US is testing tons of people so the sheer number of daily cases is not necessarily an indication that things are getting worse.
However, we know that in many places the new cases far outnumber the increases in testing and that more people are testing positive than ever before in some cities. Hospitalizations are also on the rise as hospitals prepare to handle huge surges once again.
So my advice would be to check your local state and see how your part of the country is doing so that reality can sink in. We’ve got to be careful when going out and that starts by knowing the facts about how bad the virus spread rate is.
Daniel Gillaspia is the Founder of UponArriving.com and the credit card app, WalletFlo. He is a former attorney turned travel expert covering destinations along with TSA, airline, and hotel policies. Since 2014, his content has been featured in publications such as National Geographic, Smithsonian Magazine, and CNBC. Read my bio.

The numbers were not that high before but since everything has been reopened the numbers have spiked big time the economy was reopened way too soon what needs to happen is that they need to reclose the economy for 2 months at least. This is getting ridiculous.