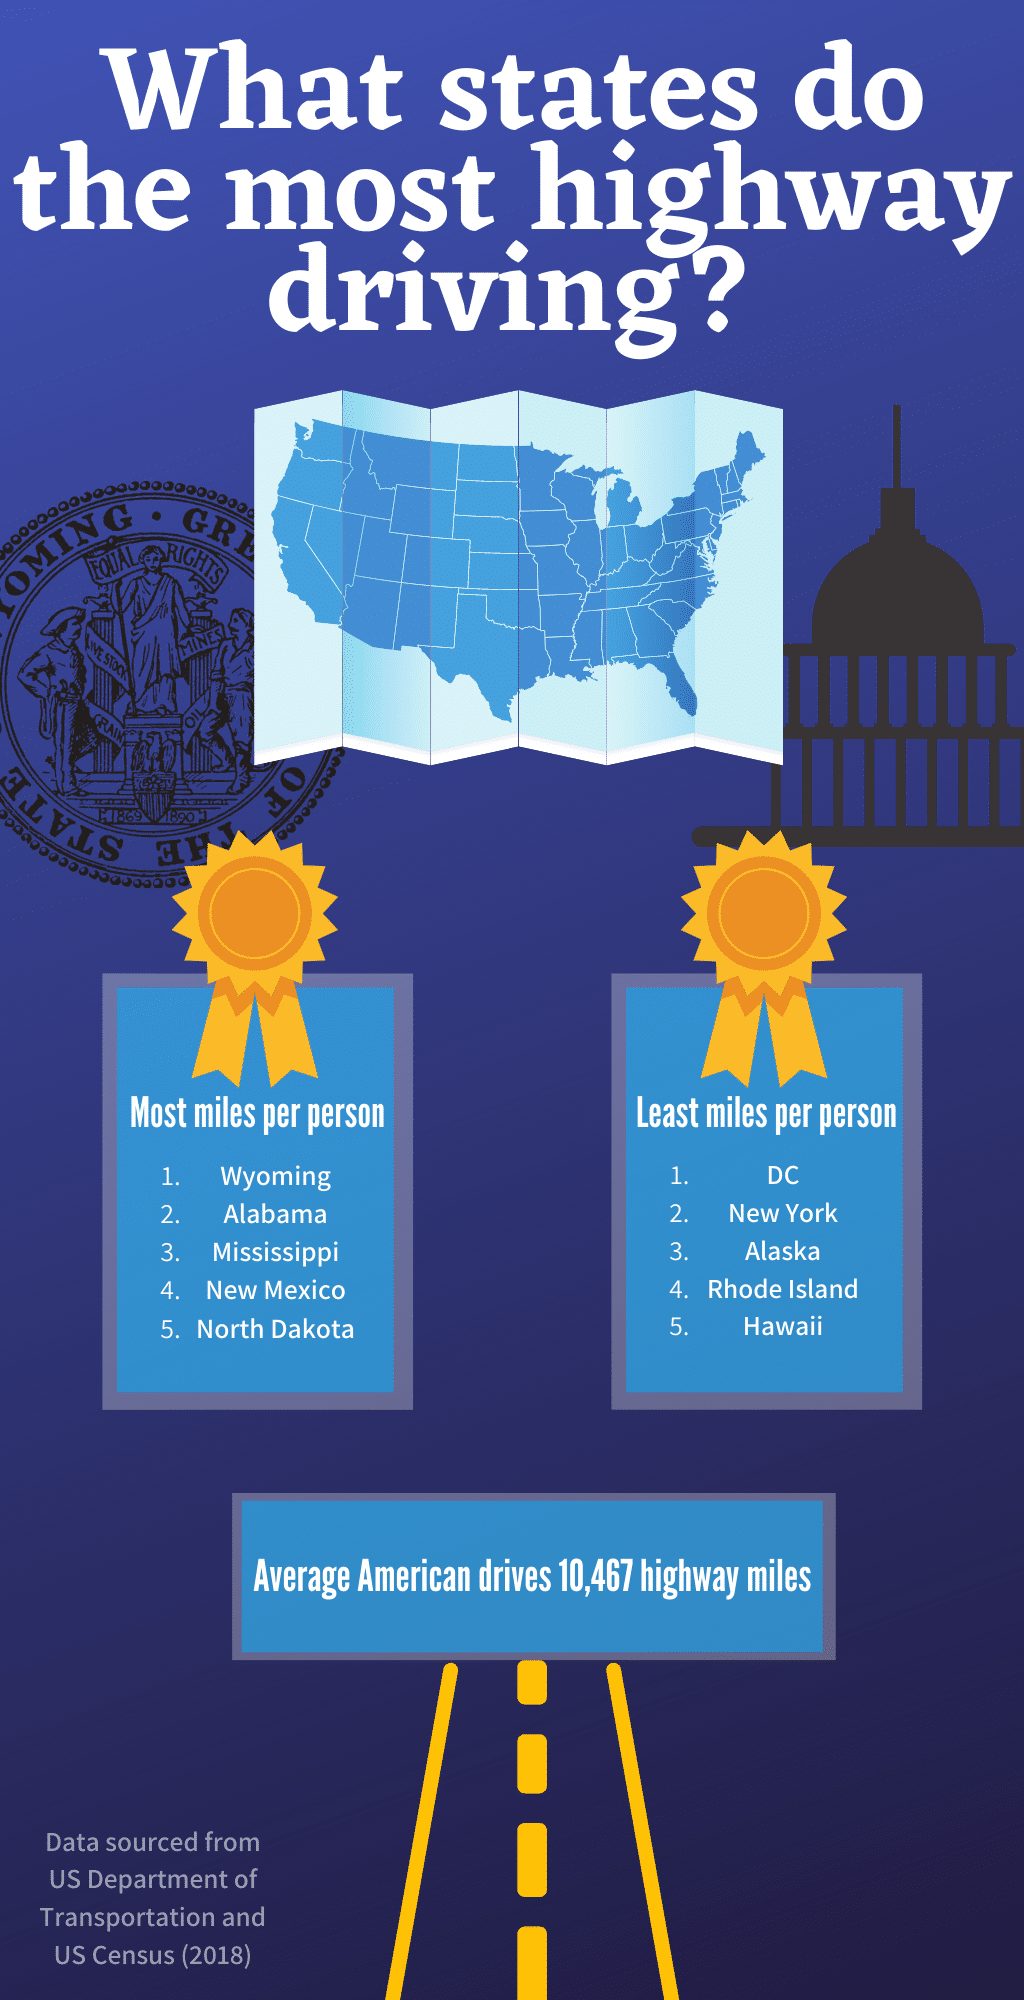
It’s no secret that Americans love to drive but have you ever wondered which states do the most highway driving?
At UponArriving, we were curious as to which states hit the highway the most and so we did a survey of the available data and the results were pretty interesting.
We were able to break down the states that do the most and least driving and also arrive at a figure of what the average American drives per year. Check out the data below!
The methodology
For our data, we relied on the statistics from the US Department of Transportation’s Federal Highway Administration and the US Census.
Specifically, the Federal Highway Administration figures are based on the most recently publicized traffic data for 2018 regarding annual vehicle driving miles (AVM) on federal aided and non-federal aided highways and the US Census data is based on population estimates for 2018.
The top five states that do the most driving overall
The five states that do the most highway driving are California, Texas, Florida, Georgia and New York.
| Rank | State | Total Miles Driven | Population | Miles Driven Per Person |
| 41 | California | 348,795,713,450 | 39,557,045 | 8,817.54 |
| 34 | Texas | 282,037,265,100 | 28,701,845 | 9,826.45 |
| 27 | Florida | 221,815,740,650 | 21,299,325 | 10,414.21 |
| 7 | Georgia | 131,455,532,780 | 10,519,475 | 12,496.40 |
| 50 | New York | 123,510,398,630 | 19,542,209 | 6,320.19 |
But these states have some of the largest populations so a much more accurate indicator of which state does the most driving is to break down the number of miles driven per person.
So using 2018 data provided by the US census, we broke down how many estimated miles are driven per person for each state and the top five results were very different.
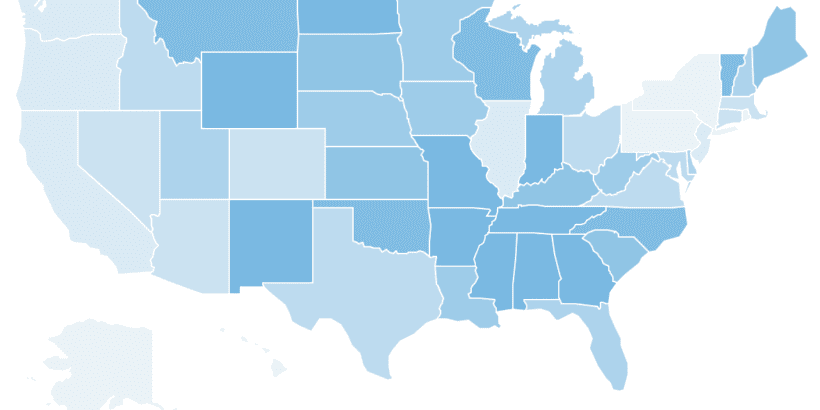
The five states that do the most driving per person
The five states that do the most highway driving per person are Wyoming, Alabama, Mississippi, New Mexico, and North Dakota.
| Rank | State | Total Miles Driven | Population | Miles Driven Per Person |
| 1 | Wyoming | 10,438,442,610 | 577,737 | 18,067.81 |
| 2 | Alabama | 71,167,206,750 | 4,887,871 | 14,559.96 |
| 3 | Mississippi | 40,730,439,490 | 2,986,530 | 13,638.05 |
| 4 | New Mexico | 27,288,306,980 | 2,095,428 | 13,022.78 |
| 5 | North Dakota | 9,855,663,670 | 760,077 | 12,966.66 |
It’s no surprise that these are some of the most rural states in the country.
The five states that do the least driving per person
You might think that the states with the least amount of miles driven per person would all be highly concentrated areas but that is also not necessarily the case. For example, Alaska made the cut for the bottom five in total miles driven per person (weather and geography is certainly a major factor).
But to no surprise other states with highly densely populated cities like New York made the bottom five as well.
| Rank | State | Total Miles Driven | Population | Miles Driven Per Person |
| 51 | District of Columbia | 3,690,677,980 | 702,455 | 5,253.97 |
| 50 | New York | 123,510,398,630 | 19,542,209 | 6,320.19 |
| 49 | Alaska | 5,487,319,990 | 737,438 | 7,441.06 |
| 48 | Rhode Island | 8,008,582,200 | 1,057,315 | 7,574.45 |
| 47 | Hawaii | 10,886,767,750 | 1,420,491 | 7,664.09 |
All 50 states broken down
Highway miles driven per person
The table below breaks down all 50 states (plus the District of Columbia) and ranks them according to how many highway miles are driven per person.
This data reveals that the average American drives a total number of 10,467.55 miles per year on highways.
| Rank | State | Total Miles Driven | Population | Miles Driven Per Person |
| 1 | Wyoming | 10,438,442,610 | 577,737 | 18,067.81 |
| 2 | Alabama | 71,167,206,750 | 4,887,871 | 14,559.96 |
| 3 | Mississippi | 40,730,439,490 | 2,986,530 | 13,638.05 |
| 4 | New Mexico | 27,288,306,980 | 2,095,428 | 13,022.78 |
| 5 | North Dakota | 9,855,663,670 | 760,077 | 12,966.66 |
| 6 | Missouri | 76,594,999,290 | 6,126,452 | 12,502.34 |
| 7 | Georgia | 131,455,532,780 | 10,519,475 | 12,496.40 |
| 8 | Indiana | 81,528,811,800 | 6,691,878 | 12,183.25 |
| 9 | Arkansas | 36,675,309,050 | 3,013,825 | 12,169.02 |
| 10 | Tennessee | 81,321,490,970 | 6,770,010 | 12,012.02 |
| 11 | Montana | 12,699,636,000 | 1,062,305 | 11,954.79 |
| 12 | Vermont | 7,346,350,180 | 626,299 | 11,729.78 |
| 13 | North Carolina | 121,127,248,630 | 10,383,620 | 11,665.22 |
| 14 | Oklahoma | 45,433,012,820 | 3,943,079 | 11,522.22 |
| 15 | Wisconsin | 65,885,434,950 | 5,813,568 | 11,333.05 |
| 16 | South Carolina | 56,800,682,760 | 5,084,127 | 11,172.16 |
| 17 | Kentucky | 49,543,606,250 | 4,468,402 | 11,087.54 |
| 18 | Kansas | 32,190,412,970 | 2,911,505 | 11,056.28 |
| 19 | Maine | 14,783,554,890 | 1,338,404 | 11,045.66 |
| 20 | South Dakota | 9,719,406,140 | 882,235 | 11,016.80 |
| 21 | Nebraska | 20,974,735,100 | 1,929,268 | 10,871.86 |
| 22 | Minnesota | 60,438,314,090 | 5,611,179 | 10,771.05 |
| 23 | West Virginia | 19,447,323,210 | 1,805,832 | 10,769.18 |
| 24 | Louisiana | 50,045,427,460 | 4,659,978 | 10,739.41 |
| 25 | Iowa | 33,282,400,050 | 3,156,145 | 10,545.27 |
| 26 | Delaware | 10,179,383,810 | 967,171 | 10,524.91 |
| 27 | Florida | 221,815,740,650 | 21,299,325 | 10,414.21 |
| 28 | Michigan | 102,397,557,490 | 9,995,915 | 10,243.94 |
| 29 | New Hampshire | 13,776,473,060 | 1,356,458 | 10,156.21 |
| 30 | Utah | 32,069,287,910 | 3,161,105 | 10,144.96 |
| 31 | Idaho | 17,709,145,780 | 1,754,208 | 10,095.24 |
| 32 | Virginia | 85,336,102,060 | 8,517,685 | 10,018.70 |
| 33 | Maryland | 59,775,435,470 | 6,042,718 | 9,892.14 |
| 34 | Texas | 282,037,265,100 | 28,701,845 | 9,826.45 |
| 35 | Ohio | 114,474,440,640 | 11,689,442 | 9,792.98 |
| 36 | Massachusetts | 66,771,980,720 | 6,902,149 | 9,674.09 |
| 37 | Colorado | 53,953,607,510 | 5,695,564 | 9,472.92 |
| 38 | Nevada | 28,319,012,180 | 3,034,392 | 9,332.68 |
| 39 | Arizona | 66,144,511,220 | 7,171,646 | 9,223.06 |
| 40 | Connecticut | 31,595,705,330 | 3,572,665 | 8,843.74 |
| 41 | California | 348,795,713,450 | 39,557,045 | 8,817.54 |
| 42 | Oregon | 36,848,416,940 | 4,190,713 | 8,792.88 |
| 43 | New Jersey | 77,538,911,170 | 8,908,520 | 8,703.90 |
| 44 | Illinois | 107,954,253,920 | 12,741,080 | 8,472.93 |
| 45 | Washington | 62,366,656,140 | 7,535,591 | 8,276.28 |
| 46 | Pennsylvania | 102,109,446,780 | 12,807,060 | 7,972.90 |
| 47 | Hawaii | 10,886,767,750 | 1,420,491 | 7,664.09 |
| 48 | Rhode Island | 8,008,582,200 | 1,057,315 | 7,574.45 |
| 49 | Alaska | 5,487,319,990 | 737,438 | 7,441.06 |
| 50 | New York | 123,510,398,630 | 19,542,209 | 6,320.19 |
| 51 | District of Columbia | 3,690,677,980 | 702,455 | 5,253.97 |
Highway miles driven total
Here’s the full breakdown of how many total miles are driven per state. The average state has 63,535,814,564 miles driven per year.
| Rank | State | Total Miles Driven | Population | Miles Driven Per Person |
| 1 | California | 348,795,713,450 | 39,557,045 | 8,817.54 |
| 2 | Texas | 282,037,265,100 | 28,701,845 | 9,826.45 |
| 3 | Florida | 221,815,740,650 | 21,299,325 | 10,414.21 |
| 4 | Georgia | 131,455,532,780 | 10,519,475 | 12,496.40 |
| 5 | New York | 123,510,398,630 | 19,542,209 | 6,320.19 |
| 6 | North Carolina | 121,127,248,630 | 10,383,620 | 11,665.22 |
| 7 | Ohio | 114,474,440,640 | 11,689,442 | 9,792.98 |
| 8 | Illinois | 107,954,253,920 | 12,741,080 | 8,472.93 |
| 9 | Michigan | 102,397,557,490 | 9,995,915 | 10,243.94 |
| 10 | Pennsylvania | 102,109,446,780 | 12,807,060 | 7,972.90 |
| 11 | Virginia | 85,336,102,060 | 8,517,685 | 10,018.70 |
| 12 | Indiana | 81,528,811,800 | 6,691,878 | 12,183.25 |
| 13 | Tennessee | 81,321,490,970 | 6,770,010 | 12,012.02 |
| 14 | New Jersey | 77,538,911,170 | 8,908,520 | 8,703.90 |
| 15 | Missouri | 76,594,999,290 | 6,126,452 | 12,502.34 |
| 16 | Alabama | 71,167,206,750 | 4,887,871 | 14,559.96 |
| 17 | Massachusetts | 66,771,980,720 | 6,902,149 | 9,674.09 |
| 18 | Arizona | 66,144,511,220 | 7,171,646 | 9,223.06 |
| 19 | Wisconsin | 65,885,434,950 | 5,813,568 | 11,333.05 |
| 20 | Washington | 62,366,656,140 | 7,535,591 | 8,276.28 |
| 21 | Minnesota | 60,438,314,090 | 5,611,179 | 10,771.05 |
| 22 | Maryland | 59,775,435,470 | 6,042,718 | 9,892.14 |
| 23 | South Carolina | 56,800,682,760 | 5,084,127 | 11,172.16 |
| 24 | Colorado | 53,953,607,510 | 5,695,564 | 9,472.92 |
| 25 | Louisiana | 50,045,427,460 | 4,659,978 | 10,739.41 |
| 26 | Kentucky | 49,543,606,250 | 4,468,402 | 11,087.54 |
| 27 | Oklahoma | 45,433,012,820 | 3,943,079 | 11,522.22 |
| 28 | Mississippi | 40,730,439,490 | 2,986,530 | 13,638.05 |
| 29 | Oregon | 36,848,416,940 | 4,190,713 | 8,792.88 |
| 30 | Arkansas | 36,675,309,050 | 3,013,825 | 12,169.02 |
| 31 | Iowa | 33,282,400,050 | 3,156,145 | 10,545.27 |
| 32 | Kansas | 32,190,412,970 | 2,911,505 | 11,056.28 |
| 33 | Utah | 32,069,287,910 | 3,161,105 | 10,144.96 |
| 34 | Connecticut | 31,595,705,330 | 3,572,665 | 8,843.74 |
| 35 | Nevada | 28,319,012,180 | 3,034,392 | 9,332.68 |
| 36 | New Mexico | 27,288,306,980 | 2,095,428 | 13,022.78 |
| 37 | Nebraska | 20,974,735,100 | 1,929,268 | 10,871.86 |
| 38 | West Virginia | 19,447,323,210 | 1,805,832 | 10,769.18 |
| 39 | Idaho | 17,709,145,780 | 1,754,208 | 10,095.24 |
| 40 | Maine | 14,783,554,890 | 1,338,404 | 11,045.66 |
| 41 | New Hampshire | 13,776,473,060 | 1,356,458 | 10,156.21 |
| 42 | Montana | 12,699,636,000 | 1,062,305 | 11,954.79 |
| 43 | Hawaii | 10,886,767,750 | 1,420,491 | 7,664.09 |
| 44 | Wyoming | 10,438,442,610 | 577,737 | 18,067.81 |
| 45 | Delaware | 10,179,383,810 | 967,171 | 10,524.91 |
| 46 | North Dakota | 9,855,663,670 | 760,077 | 12,966.66 |
| 47 | South Dakota | 9,719,406,140 | 882,235 | 11,016.80 |
| 48 | Rhode Island | 8,008,582,200 | 1,057,315 | 7,574.45 |
| 49 | Vermont | 7,346,350,180 | 626,299 | 11,729.78 |
| 50 | Alaska | 5,487,319,990 | 737,438 | 7,441.06 |
| 51 | District of Columbia | 3,690,677,980 | 702,455 | 5,253.97 |
Daniel Gillaspia is the Founder of UponArriving.com and the credit card app, WalletFlo. He is a former attorney turned travel expert covering destinations along with TSA, airline, and hotel policies. Since 2014, his content has been featured in publications such as National Geographic, Smithsonian Magazine, and CNBC. Read my bio.
